These days, data isn’t simply a tool at work; it’s also a plan. The numbers that show how well the effort is doing affect every decision, from how to deploy resources to how well a campaign is going. But a lot of companies still have vital information spread out over several places, like emails, spreadsheets, and tools that don’t operate well together.
The best project management tools alter everything. They gather data, write their own reports, and explain how performance, priorities, and results are all connected. Instead of teams having to guess, executives can see what’s working.
This change is all about Lark. It turns everyday tasks into a continual stream of information by combining communication, execution, and analytics. Here are some ways that its features assist individuals at all levels in making decisions based on data.
Lark Base: Building a foundation of connected intelligence
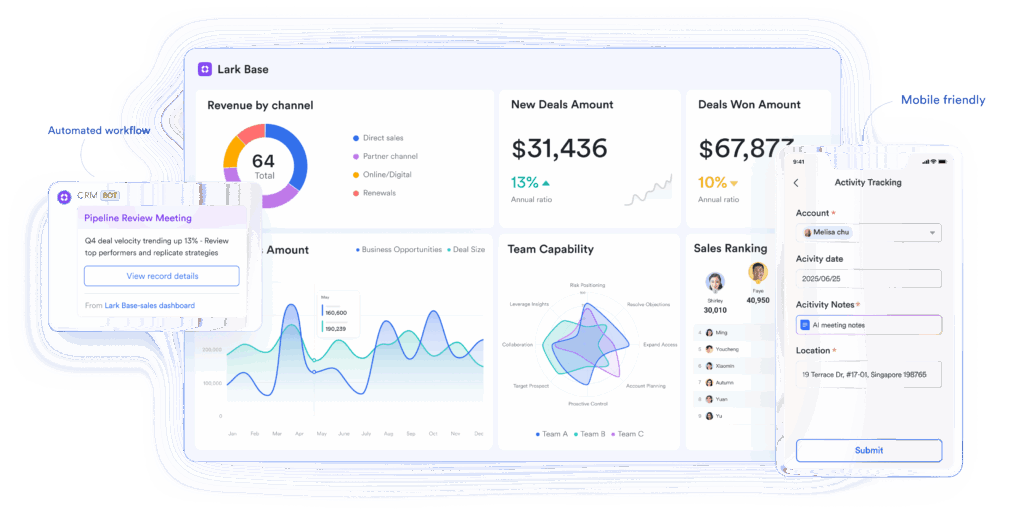
Lark Base is the most essential part of Lark’s ecosystem—a central hub where teams can gather, organize, and analyze operational data. Companies can build customizable databases that connect directly to projects, tasks, and performance metrics, eliminating the need for multiple spreadsheets.
Base transforms raw data into actionable information that anyone can understand and use, even without technical expertise.
Through its dynamic structure and automated workflow capabilities, Base ensures that information flows seamlessly across departments, keeping every decision grounded in real-time visibility. The result is a clear, organized view of company performance that helps leaders act decisively and guide growth with confidence.
Key functions:
-
Your own data structure: Set up databases for each team, such as sales, projects, HR, or finance, and let them adjust the fields and filters to match their needs.
-
Live dashboards: Make reports and performance views that show up in pictures and change automatically when records do.
-
Records that are linked to one another: Link information from different areas of the business. For example, link client contracts in finance to the work that needs to be done in operations.
-
Smart permissions: Let different teams see the same data without changing analytics.
-
Automated alerts: Trigger notifications when key metrics hit thresholds, ensuring decisions are proactive, not reactive.
Lark Sheets: Turning numbers into narrative
Base gives you a platform for making stories out of data, while Lark Sheets enables you to look at it more deeply. It’s not just a spreadsheet; it’s a live analytics engine that connects to the rest of the workspace.
Teams may keep an eye on KPIs, monitor how things are evolving, and make financial projections using live data from Base, Tasks, or Docs. You don’t need to reload or import; the numbers change when the task changes.
Key functions:
-
Keep data in sync in real time: Automatically get data from other Lark products, so you don’t have to edit Sheets yourself.
-
Collaborative modelling: More than one person can work on the same sheet at the same time, and the version control mechanism is still there.
-
Advanced formulas and charts: You may uncover patterns, create forecasts, and share data on dashboards straight away.
-
Linked analytics: Put Sheets in Docs or Base so that everyone in the company can see what’s going on.
-
Instant filters and pivots: You can instantly find out how well any team, product, or time period is doing.
Lark Tasks: From execution data to performance analytics
Execution delivers the best performance indicators, such as deadlines, completion rates, workloads, and dependencies. It helps you learn how things are done and how well they operate. Lark Tasks makes things that happen right now.
When a job changes, it is added to a system that can be measured to maintain track of productivity, efficiency, and responsibility. The result is not simply better execution, but also improvement based on data.
Key functions:
-
Performance dashboards: You can view how many tasks are done, how many are late, and how rapidly things are getting done right now.
-
Workload analytics: Find out how much work your team can do and modify the way it’s divided up so that no one feels overwhelmed or stuck.
-
Keeping track of dependencies: Figure out which people or projects are slowing things down and adjusting your plans so that they work better.
-
Linking outcomes: Automatically connect the results of tasks to wider goals so that the Base and OKR dashboards can understand what’s going on.
Lark Docs: Centralizing insight through dynamic documentation
Analytics are only useful when everyone can see them, and Lark Docs makes sure that everyone who works together can always get to the data. Docs creates living documents that include text, graphics, and data that updates in real time.
This is not the same as reports or presentation decks, which don’t change. Teams can use dashboards, sheets, and charts in performance assessments or plan documents. This makes sure that judgments are always based on the most recent facts.
Key functions:
-
Live data embedding: You can add Base tables, Sheets charts, and progress bars that change on their own.
-
Collaborative analysis: More than one person can add notes, explain things, and make discoveries at the same time.
-
Linked context: Know what KPIs or projects you’re talking about when you write reports.
-
Turning comments into actions: As soon as you finish the analysis, place events or assignments on your agenda.
-
Version continuity: Don’t have to produce new papers for every upgrade; just keep your analysis going.
Lark OKR: Measuring what matters most
Data isn’t helpful on its own; it has to be used for something. Lark OKR makes sure that analytics and results are in sync by linking team actions to strategic goals. You may measure the most important outcomes of each goal, and the workspace data will automatically update them. This feedback loop that keeps going lets leaders observe not only what is being done but also how well it is working.
Key functions:
-
Keeping track of development in real time: When activities are done, base metrics are satisfied, or project milestones are reached, change OKRs automatically.
-
Performance visibility: You can see how much work each team, department, or project has done on one dashboard.
-
Aligning goals: Make sure that each measured outcome is in accordance with the organization’s larger goal.
-
Data that can help you make guesses: You can use trend visualisation to figure out right away if any of your initiatives aren’t going well.
-
Information on participation: To make the culture of accountability stronger, keep track of who is taking part and who is in charge of goals.
Lark Calendar: Time-based insights for smarter planning
Lark Calendar takes time and makes it one of the best tools for looking at data in the process. By looking at every planned event, meeting length, and follow-up, we can see how teams use their most important resources.
Calendar analytics indicate trends in how much work people do, how many meetings they have, and how well they get along with each other. This enables managers to come up with ideas that work well for attendance and performance.
Key functions:
-
Usage analytics: Keep track of how much time is spent on planning, meetings, and getting things done.
-
Things that happen because of outcomes: You may keep track of how much time you gain back by linking the results of meetings to Tasks or OKRs.
-
Smart scheduling: Look at how much work has to be done and when team members are free to discover the optimum periods.
-
Historical insights: Use calendar data from the past to show how much better your planning has improved.
-
Contextual visibility: You can access associated Docs or Base data from any event without losing your focus or flow.
Conclusion
Data is no longer only the result of work; it is the job itself. Teams that can examine, evaluate, and change in real time are the ones that do best in today’s competitive market. Lark gives businesses an edge by making it possible to learn new things all the time by working together.
Base’s structured databases, Sheets’ deep analysis, Tasks’ performance measurements, and OKR’s strategic tracking all work together to make one data ecosystem. They work together to turn raw activity into measurable results by putting together pieces of information to make a complete picture of the issue.
This is a new benefit for leaders right now. Lark is not just another project management software. It’s a platform that takes data that would otherwise be background noise and makes it the backbone of a business, giving them the confidence and clarity they need to work, change, and grow.

